Overview
At the top of the Optimizer View, you’ll find:- Optimizer Name: Clearly labeled for easy identification.
- Objective: A brief description of what the optimizer is aiming to improve (e.g., “Improve click-through for sign-up button”).
- Export Options: Buttons to Export CSV data or View in Editor for deeper customization.
Main Chart Area
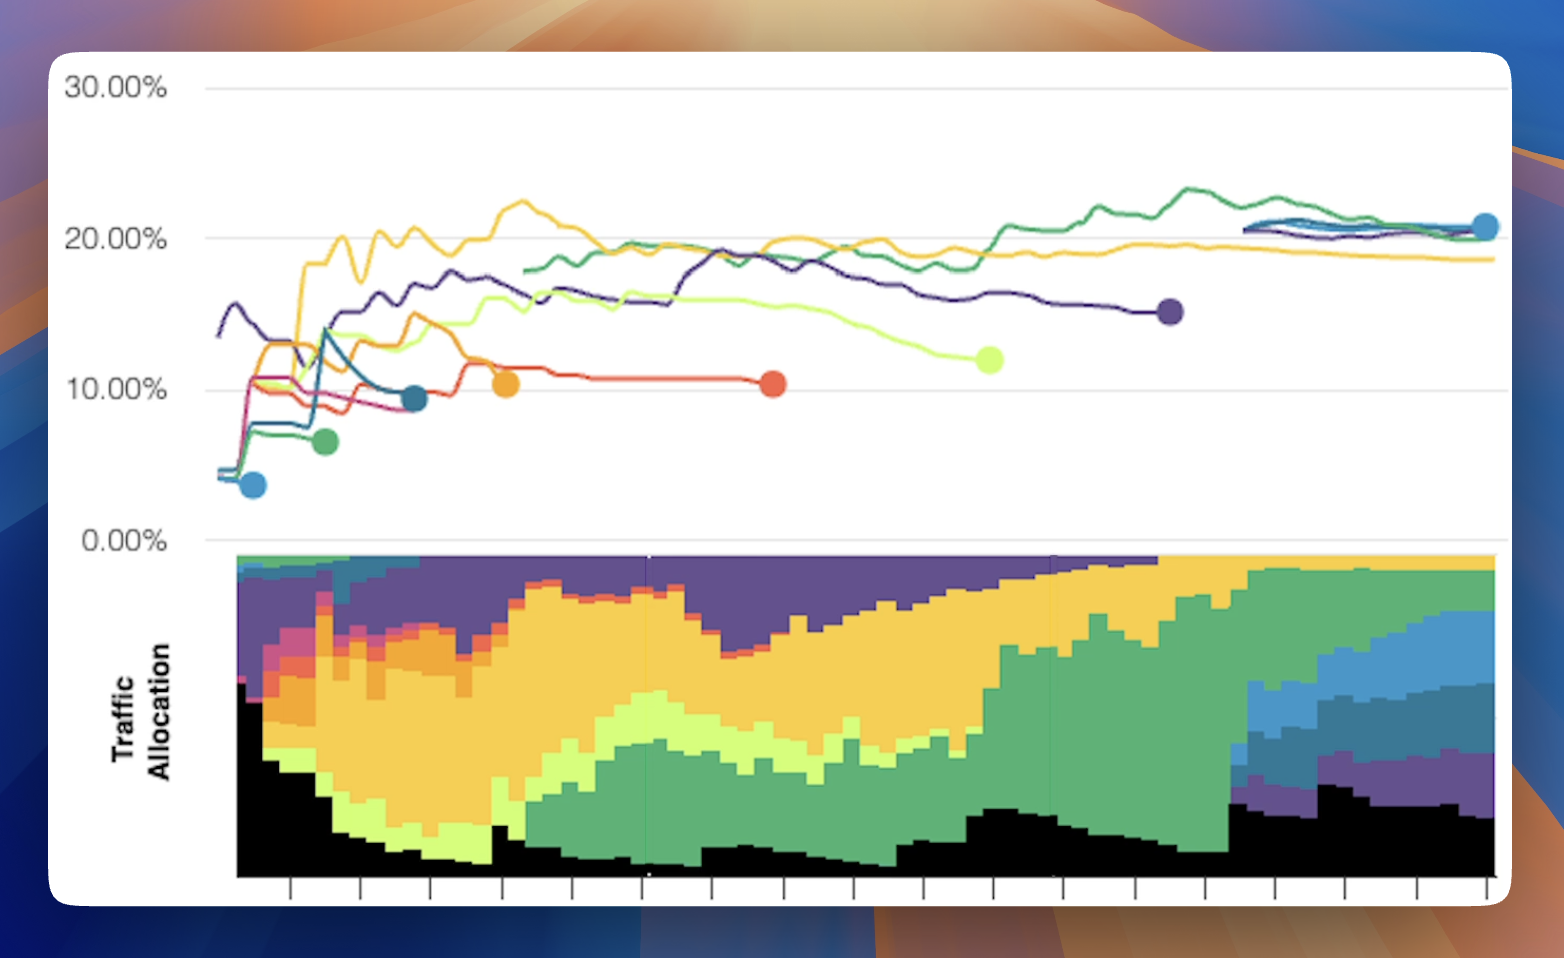
The main area of the Optimizer View features a unique, dual-layered chart that visualizes both the performance and traffic allocation of your variants over time.Performance Chart
- Line Chart: Displays the conversion rate of each variant over time.
- Confidence Intervals: Optionally show or hide 95% credible intervals to understand the statistical reliability of the data.
- Pan and Zoom: Navigate through different time frames by panning and zooming on the chart.
- Date Range Selection: Customize the time period for which data is displayed.
-
Conversion Rate Chart:
- Line chart displaying variant conversion rates over time
- Color-coded lines for each variant
- Y-axis: conversion rate %, X-axis: time
-
Traffic Allocation Chart:
- 100% stacked bar chart showing traffic distribution
- Matching colors to conversion rate chart
- Y-axis: traffic %, X-axis: aligned with upper chart
Variant Selection
- Toggle Variants: Select or deselect variants to include in the charts.
Chart Views
Switch between different data perspectives using the view toggles:- Performance: The default view showing conversion rates and traffic allocation.
- Visitors: Replaces the performance chart with a bar chart displaying the number of visitors, adjustable by hour, day, or week.
- Events: Focuses on conversion events as defined in your objectives, also adjustable by time intervals.
Variant Insights Panel
To the right of the main chart, the Variant Insights Panel provides a quick snapshot of variant performance:- Color-Coded Rankings: Variants are listed and color-coded according to their performance metrics.
- Sorting: Automatically sorted based on the selected metric—conversion lift, visitor count, or event count.
Managing Variants
Variants to Approve
Coframe’s AI periodically generates new variants that require your approval before going live.- Preview Variants: See how each proposed variant looks on your website.
- AI-Generated Rationale: Understand the reasoning behind each variant’s creation.
- Approve or Disapprove: Quickly make decisions to keep your optimization process moving.
- Edit Variants: Modify variants directly in the dashboard or open them in the editor for advanced changes.
Generate New Variants
- Quality Mode: Generates high-quality variants using a comprehensive AI process (approximately 1 minute).
- Fast Mode: Quickly generates variants using a powerful, closed-source model.
- Customization: Tailor the generation process according to your needs for speed or quality.
Variants Table
Keep track of all your variants in one place.- Status Indicators: Easily see if a variant is the baseline, live, or queued.
- Essential Metrics:
- Title: The name of the variant.
- Visitors: Number of visitors exposed to the variant.
- Conversions: Number of conversions attributed to the variant.
- Conversion Rate: Percentage of visitors who converted.
Advanced Options
- Confidence Intervals: Toggle to display the 95% credible interval for each variant’s conversion rate.
- Impact Accounting:
- Coverage: Percentage of total traffic allocated to the variant.
- Global Lift: Overall impact of the variant compared to the holdout baseline.
- Statistical Details:
- P(Winner): Probability that the variant is the best performer.
- P(Baseline): Probability that the variant will outperform the baseline.
Actions
- Preview on Website: See the variant in action on your live site.
- Copy ID: Easily copy the variant ID for reference or support inquiries.
- Delete Variant: Remove underperforming or unwanted variants.
Search and History
- Search Bar: Find variants by title, ID, or content keywords.
- Variant History: Access a complete log of all dropped variants by clicking the History button.
Navigating to the Optimizer View
Access the Optimizer View by selecting an optimizer from the Optimizers table in your page-level dashboard. This table provides a high-level overview of all your optimizers, including their objectives and current performance metrics.Tips for Maximizing the Optimizer View
- Regularly Approve Variants: Keep the optimization process dynamic by reviewing and approving new variants.
- Use Advanced Metrics: Dive into confidence intervals and statistical details to make informed decisions.
- Customize Your View: Adjust date ranges, toggle metrics, and select variants to focus on the data that matters most to you.